Dưới đây là bài mẫu IELTS Writing Task 1 dạng Bar Chart, giúp bạn tự luyện thi IELTS tại nhà!

Ví dụ 1
Bài mẫu IELTS Writing Task 1
You should spend about 20 minutes on this task.
The chart shows components of GDP in the UK from 1992 to 2000.
Summarize the information by selecting and reporting the main features and make comparisons where relevant.
Write at least 150 words.

Bài làm mẫu:
The bar chart illustrates the gross domestic product generated from the IT and Service Industry in the UK from 1992 to 2000. It is measured in percentages. Overall, it can be seen that both increased as a percentage of GDP, but IT remained at a higher rate throughout this time.
At the beginning of the period, in 1992, the Service Industry accounted for 4 percent of GDP, whereas IT exceeded this, at just over 6 percent. Over the next four years, the levels became more similar, with both components standing between 6 and just over 8 percent. IT was still higher overall, though it dropped slightly from 1994 to 1996.
However, over the following four years, the patterns of the two components were noticeably different. The percentage of GDP from IT increased quite sharply to 12 in 1998 and then nearly 15 in 2000, while the Service Industry stayed nearly the same, increasing to only 8 percent.
At the end of the period, the percentage of GDP from IT was almost twice that of the Service Industry.
(Words 178)
Ví dụ 2
You should spend about 20 minutes on this task.
The bar chart shows the scores of teams A, B and C over four different seasons.
Summarize the information by selecting and reporting the main features and make comparisons where relevant.
Write at least 150 words.
Bài làm mẫu:
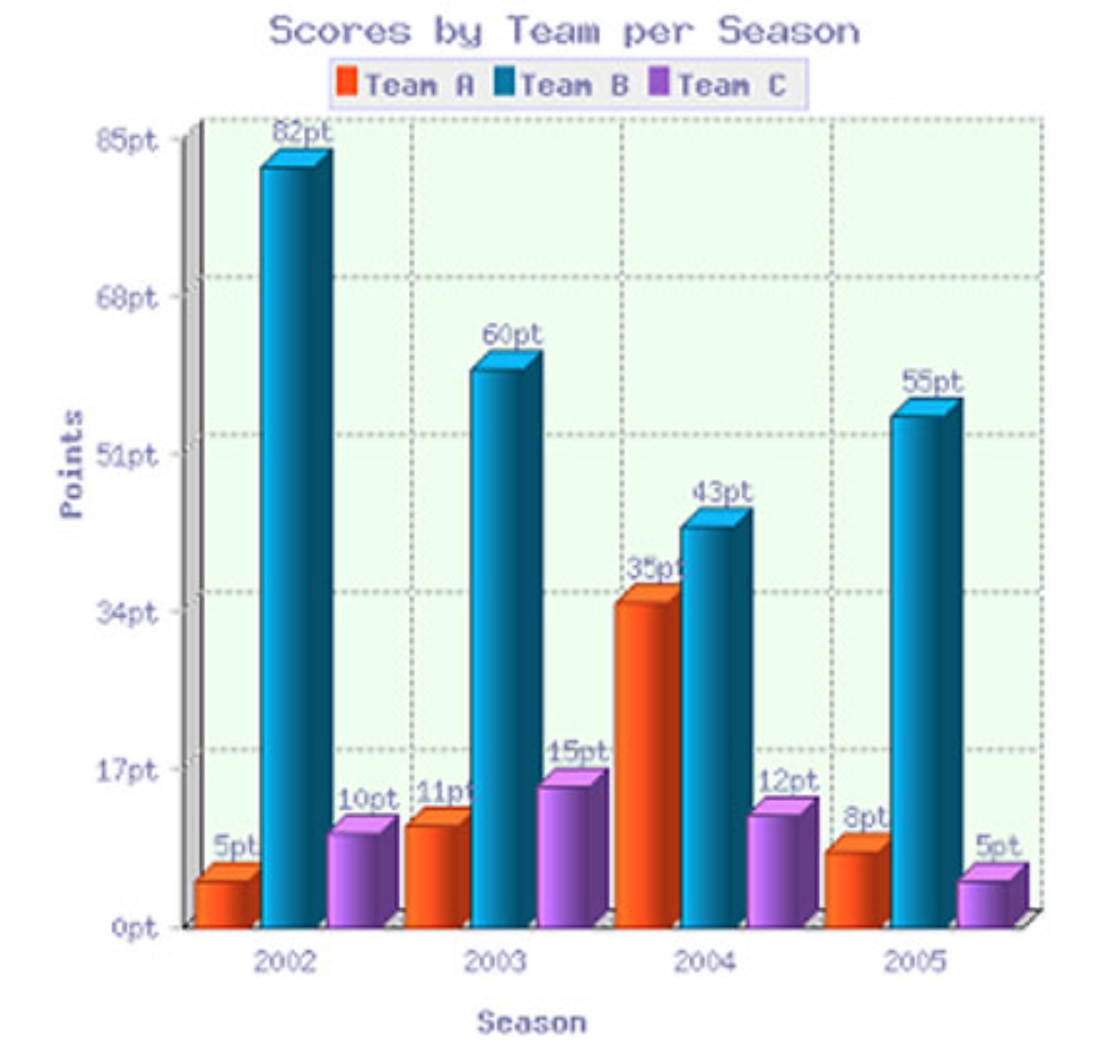
The bar chart shows the scores of three teams, A, B and C, in four consecutive seasons. It is evident from the chart that team B scored far higher than the other two teams over the seasons, though their score decreased as a whole over the period.
In 2002, the score of team B far exceeded that of the other two teams, standing at 82 points compared to only 10 for team C and a very low 5 for team A. Over the next two years, the points for team B decreased quite considerably, dropping by around half to 43 by 2004, but they still remained above the points for the other teams.
However, though team A and C’s points were lower, they were rising. Team A’s points had increased by 600% from 2002 to reach 35 points by 2004, nearly equal to team B. Team C, meanwhile, had managed only a small increase over this time.
In the final year, team B remained ahead of the others as their points increased again to 55, while team A and C saw their point scores reverse and drop to 8 and 5 respectively.
(Words 164)
Ví dụ 3
You should spend about 20 minutes on this task.
The chart shows British Emigration to selected destinations between 2004 and 2007.
Summarize the information by selecting and reporting the main features and make comparisons where relevant.
Write at least 150 words.
Bài làm mẫu
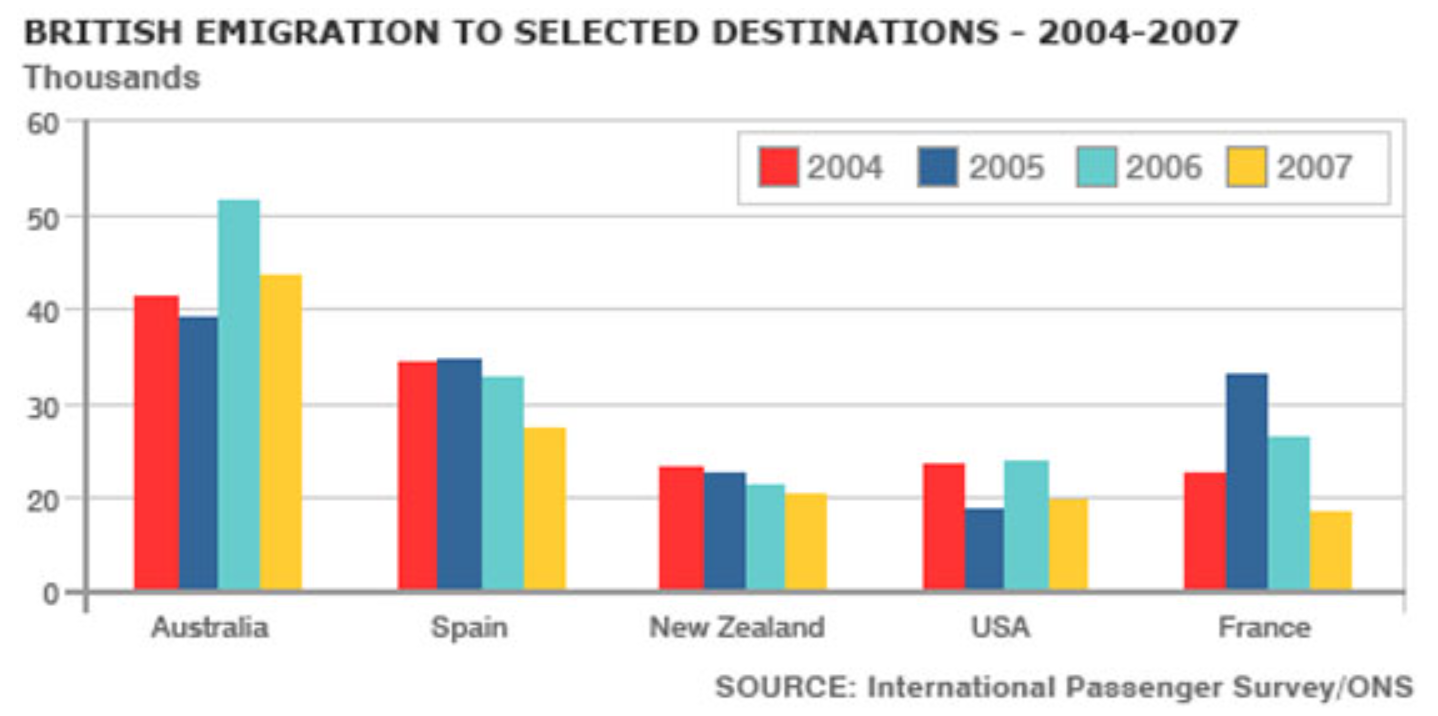
The bar chart shows the number of British people who emigrated to five destinations over the period 2004 to 2007. It is evident from the chart that throughout the period, the most popular place to move to was Australia.
Emigration to Australia stood at just over 40,000 people in 2004, which was approximately 6,000 higher than for Spain, and twice as high as the other three countries. Apart from a jump to around 52,000 in 2006, it remained around this level throughout the period.
The next most popular country for Britons to move to was Spain, though its popularity declined over the time frame to finish at below 30,000 in 2007. Despite this, the figure was still higher than for the remaining three countries. Approximately 20,000 people emigrated to New Zealand each year, while the USA fluctuated between 20-25,000 people over the period.
Although the number of visitors to France spiked to nearly 35,000 in 2005, it was the country that was the least popular to emigrate to at the end of the period, at just under 20,000 people.
(Words 179)
Ví dụ 4 bài mẫu IELTS Writing task 1 dạng bar chart
You should spend about 20 minutes on this task.
The following bar chart shows the different modes of transport used to travel to and from work in one European city in 1960, 1980 and 2000.
Summarize the information by selecting and reporting the main features and make comparisons where relevant.
Write at least 150 words.

Bài làm mẫu:
The bar chart shows the changing patterns of transport use in a European city during the period from 1960 to 2000. In brief, the chart shows that the use of the car as a means of transport dramatically increased over the period shown, while the others fell.
In detail, in 1960 the motor car was used least as a method of transport with only about 7% of the population using this method but car use grew steadily and strongly to finally reach about 37% of the population by 2000. This was a massive 5-fold increase in use.
Over this same period, however, the popularity of walking, which had been the most popular means of transport with 35% of the population in 1960 having it as their preferred way of getting around, fell to 10%. Bicycle use also fell from a high of about 27% in 1960 to just 7% in 2000.
On the other hand, bus use was more erratic being popular with almost 20% of the population in 1960 and rising to a peak of about 27% in 1980 before falling back to about 18% in 2000.
(188 Words)
Source: ieltsbuddy


Nếu bạn quan tâm khóa học tiếng Anh Dẫn Tour Giao Tiếp Thực tế hay khóa học luyện thi IELTS của Efis English, hãy nhắn ngay cho tụi mình để được tư vấn miễn phí nhé!
————————————————————————————–
Efis English – Hanoi Free Private Tour Guide
✯ https://efis.edu.vn/
♟158 Chùa Láng, Đống Đa, Hà Nội
☎ 0961.764.299
☞ efisenglish@gmail.com
✤ Fanpage IELTS: IELTS Complete – IELTS Toàn diện
✤ Fanpage EFIS ENGLISH: EFIS English – Học tiếng Anh thực tế
✤ Fanpage HANOI FREE PRIVATE TOUR GUIDE:
Hanoi Free Private TOUR GUIDE – Dẫn tour cho người nước ngoài Học tiếng Anh
✤ TikTok: Efis English
✤ Youtube: Efis English – Hanoi Free Private Tour Guide
Có thể bạn quan tâm:
Học tiếng anh giao tiếp online miễn phí
Phương pháp học tiếng anh giao tiếp miễn phí hiệu quả
Những trường Đại học xét bằng IELTS 2021
Tiếng Anh giao tiếp theo chủ đề | 30 topic thường gặp
Bài writing ielts mẫu task 1 dạng Process Diagram


 kèm đáp án mẫu")


