
Dưới đây là một số dạng bài mẫu Writing Task 1 dạng Pie Chart cho những bạn nào đang luyện thi IELTS muốn tham khảo nha!
IELTS Writing Task 1 ví dụ 1
Bài mẫu Writing Task 1
You should spend about 20 minutes on this task.
The pie chart shows the amount of money that a children’s charity located in the USA spent and received in one year, 2016.
Summarize the information by selecting and reporting the main features and make comparisons where relevant.
Write at least 150 words.

Bài làm mẫu:
The pie charts show the amount of revenue and expenditures in 2016 for a children’s charity in the USA. Overall, it can be seen that donated food accounted for the majority of the income, while program services accounted for the most expenditure. Total revenue sources just exceeded outgoings.
In detail, donated food provided most of the revenue for the charity, at 86%. Similarly, with regard to expenditures, one category, program services, accounted for nearly all of the outgoings, at 95.8%.
The other categories were much smaller. Community contributions, which were the second largest revenue source, brought in 10.4% of overall income, and this was followed by program revenue, at 2.2%. Investment income, government grants, and other income were very small sources of revenue, accounting for only 0.8% combined.
There were only two other expenditure items, fundraising and management and general, accounting for 2.6% and 1.6% respectively. The total amount of income was $53,561,580, which was just enough to cover the expenditures of $53,224,896.
(161 Words)
Ví dụ 2
You should spend about 20 minutes on this task.
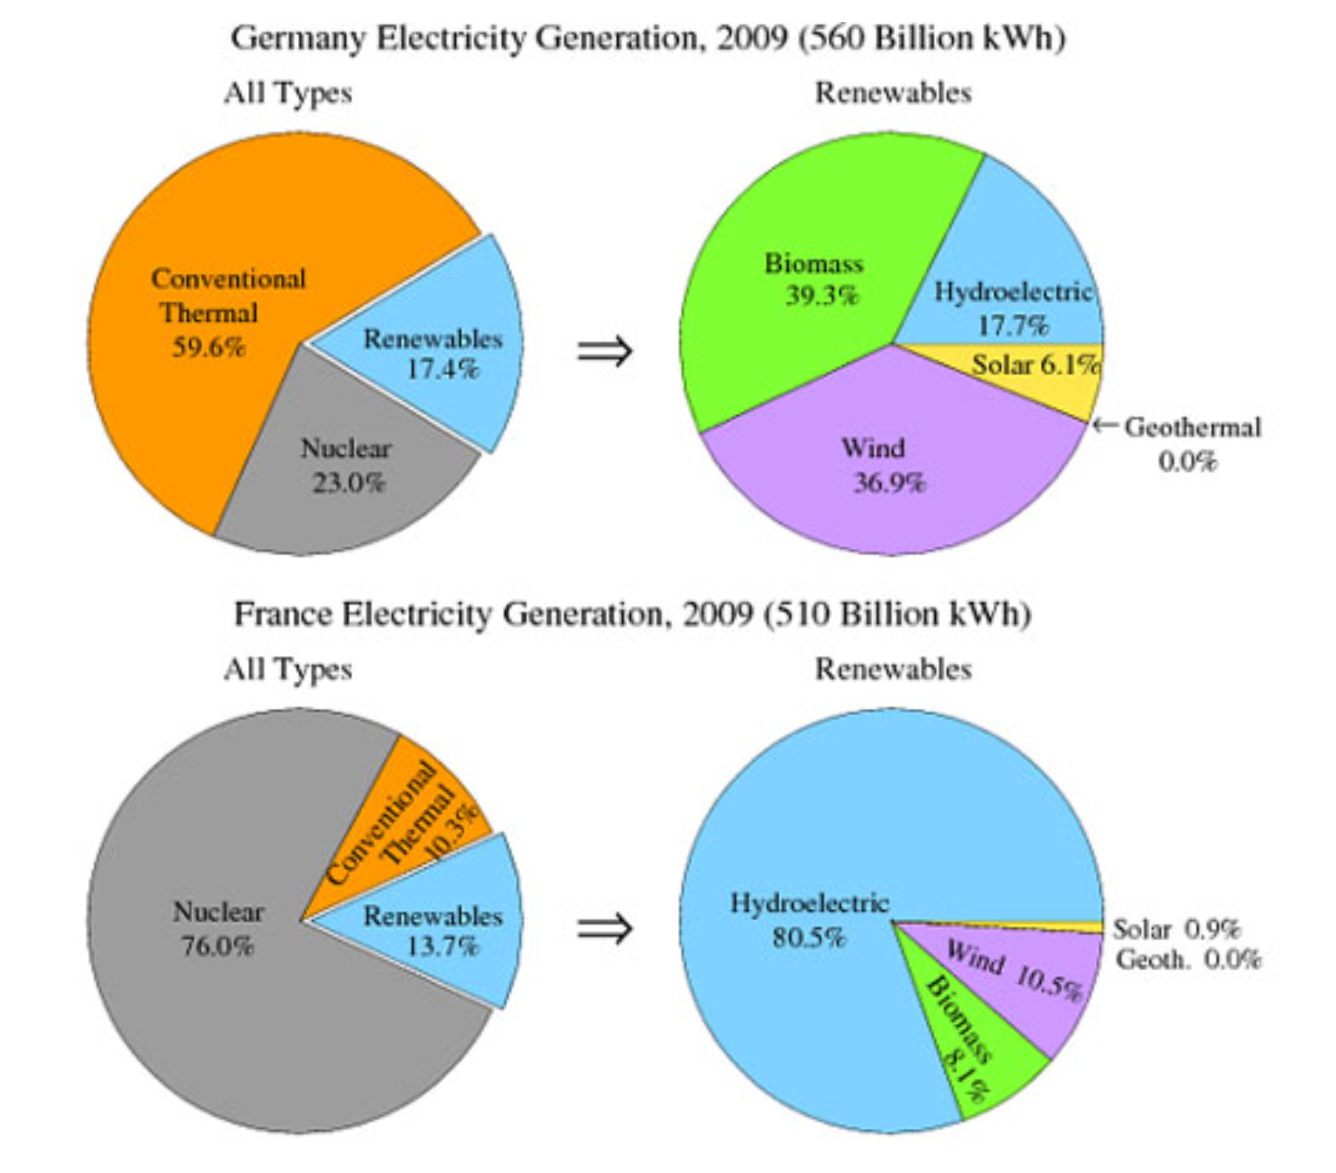
The pie charts show the electricity generated in Germany and France from all sources and renewables in the year 2009.
Summarize the information by selecting and reporting the main features and make comparisons where relevant.
Write at least 150 words.
Bài làm mẫu:
The four pie charts compare the electricity generated between Germany and France during 2009, and it is measured in billions kWh. Overall, it can be seen that conventional thermal was the main source of electricity in Germany, whereas nuclear was the main source in France.
The bulk of electricity in Germany, whose total output was 560 billion kWh, came from conventional thermal, at 59.6%. In France, the total output was lower, at 510 billion kWh, and in contrast to Germany, conventional thermal accounted for just 10.3%, with most electricity coming from nuclear power (76%). In Germany, the proportion of nuclear power generated electricity was only one fifth of the total.
Moving on to renewables, this accounted for quite similar proportions for both countries, ranging from around 14% to 17% of the total electricity generated. In detail, in Germany, most of the renewables consisted of wind and biomass, totaling around 75%, which was far higher than for hydroelectric (17.7%) and solar (6.1%). The situation was very different in France, where hydroelectric made up 80.5% of renewable electricity, with biomass, wind and solar making up the remaining 20%. Neither country used geothermal energy.
(191 Words)
Bài mẫu writing task 1 dạng pie chart ví dụ 3
You should spend about 20 minutes on this task.
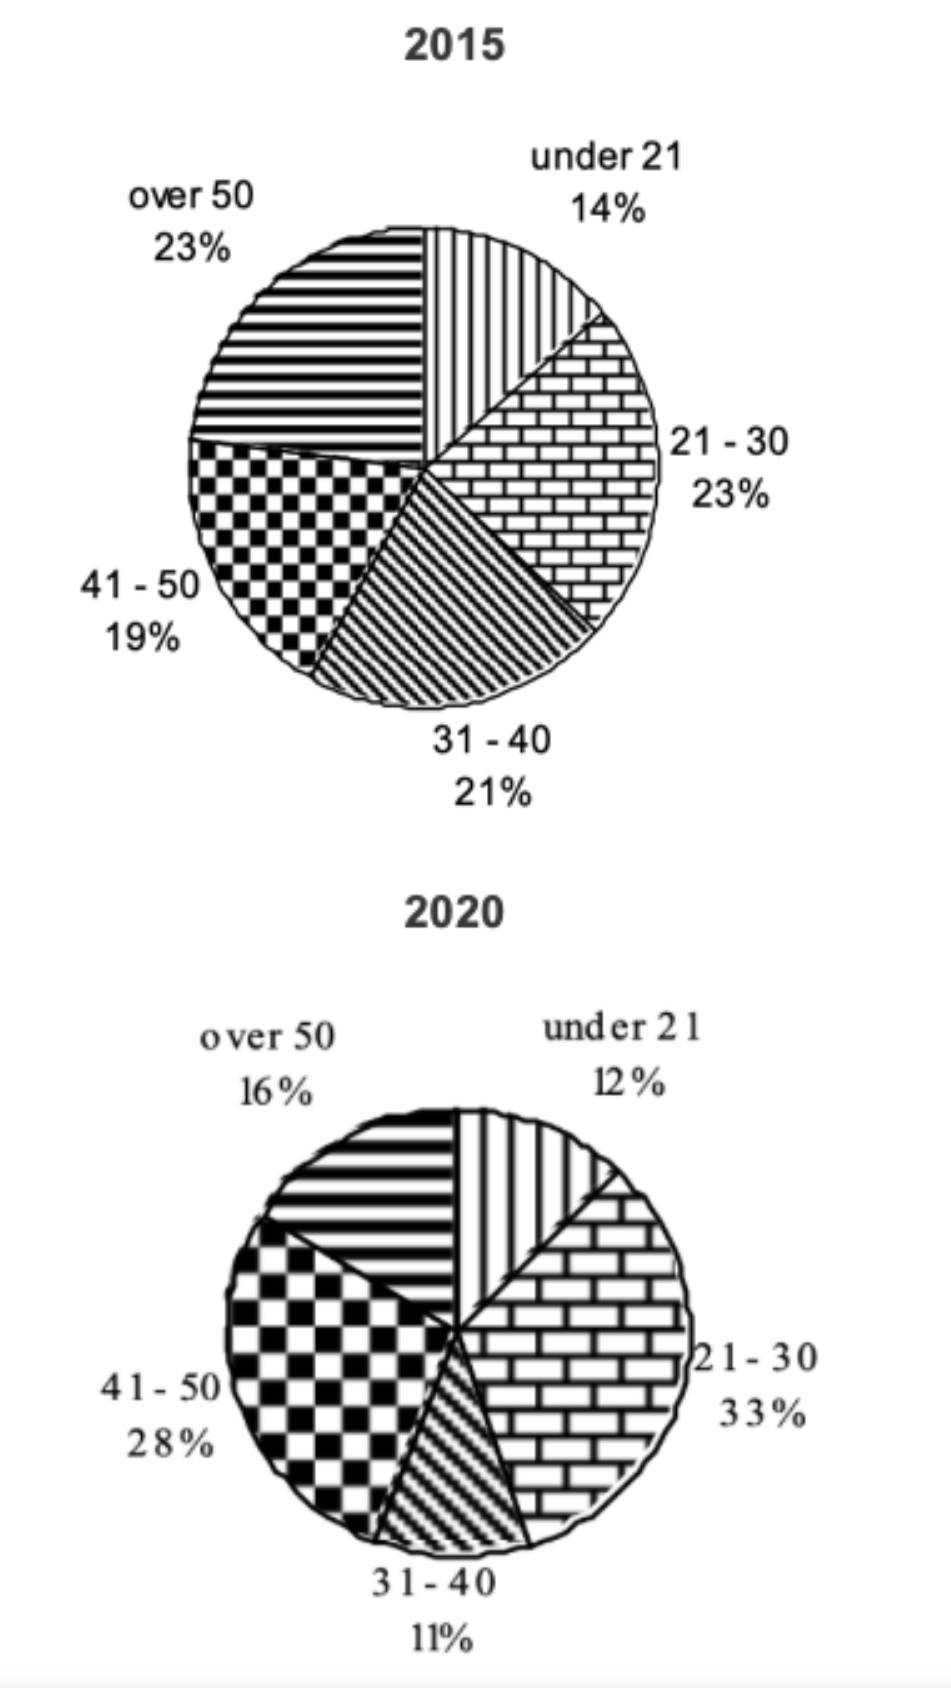
The chart below shows the proportion of staff employed by age in the public sector in the UK in 2015 and 2020.
Summarize the information by selecting and reporting the main features and make comparisons where relevant.
Write at least 150 words.
Bài làm mẫu:
The pie charts illustrate the ages of people employed in the UK public sector during two years, 2015 and 2020. Overall, while the percentage of those employed in their 20s and 40s increased, employment for other ages groups, particularly the over 50s, fell.
Turning first to the younger age groups, although the employment of workers under 21 actually fell from 14% in 2015 to 12% in 2020, the overall number of workers under 30 actually rose because of the surge in employment of 21-30 year olds, which increased significantly from 23% to 33%. Similarly, the number of employees over the age of 40 climbed from 19% in 2015 to 28% by 2020.
However, other groups saw quite significant falls in employment. For 31-40 year olds, the employment figure plummeted from 21% in 2015 to just 11% by 2020, which represented a substantial drop of more than 50% in relative terms. Likewise, the employment of over 50s declined, though not by quite so much, standing at 23% in 2015 and 16% in 2020.
(172 Words)

Source: ieltsbuddy


Nếu bạn quan tâm khóa học tiếng Anh Dẫn Tour Giao Tiếp Thực tế hay khóa học luyện thi IELTS của Efis English, hãy nhắn ngay cho tụi mình để được tư vấn miễn phí nhé!
————————————————————————————–
Efis English – Hanoi Free Private Tour Guide
✯ https://efis.edu.vn/
♟158 Chùa Láng, Đống Đa, Hà Nội
☎ 0961.764.299
☞ efisenglish@gmail.com
✤ Fanpage IELTS: IELTS Complete – IELTS Toàn diện
✤ Fanpage EFIS ENGLISH: EFIS English – Học tiếng Anh thực tế
✤ Fanpage HANOI FREE PRIVATE TOUR GUIDE:
Hanoi Free Private TOUR GUIDE – Dẫn tour cho người nước ngoài Học tiếng Anh
✤ TikTok: Efis English
✤ Youtube: Efis English – Hanoi Free Private Tour Guide
Có thể bạn quan tâm:
Những trường Đại học xét bằng IELTS 2021
Tiếng Anh giao tiếp theo chủ đề | 30 topic thường gặp
Mất bao lâu để tăng điểm IELTS lên 1 band
Lộ trình học ielts 6.5 rõ ràng và chi tiết nhất
Bài mẫu Reading IELTS kèm đáp án


 kèm đáp án mẫu")


